核心思想
使用已有的PTP(IEEE 1588 Precision Time Protocol)进行数据中心网络latency和丢包率测量
PTP
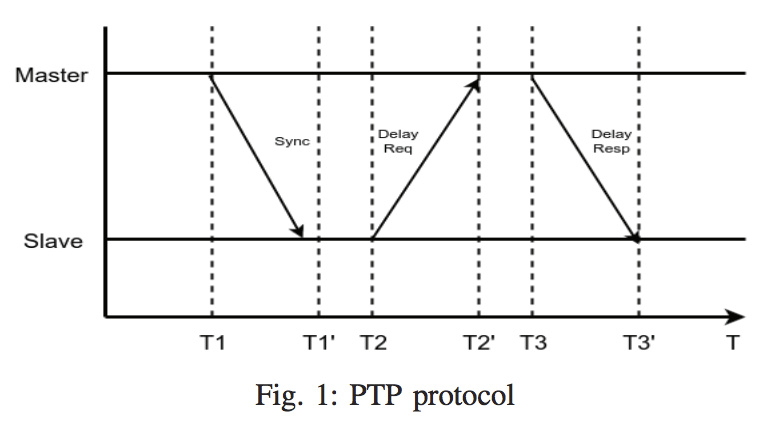
one-way delay: \(1/2 * (master\_to\_slave\_delay + slave\_to\_master\_delay)\)
master-to-slave-delay: $ T1-T1^{’}$
slave-to-master-delay: $ T2-T2^{’}$
The time difference between the master and slave clocks represents the clock offset from master and is computed as a difference between the master-to-slave delay and the one-way delay.
PTPmesh
尽管 PTP-enabled NICs 更准确,本文聚焦于开源的软件实现,PTPd.
-
Network latency
-
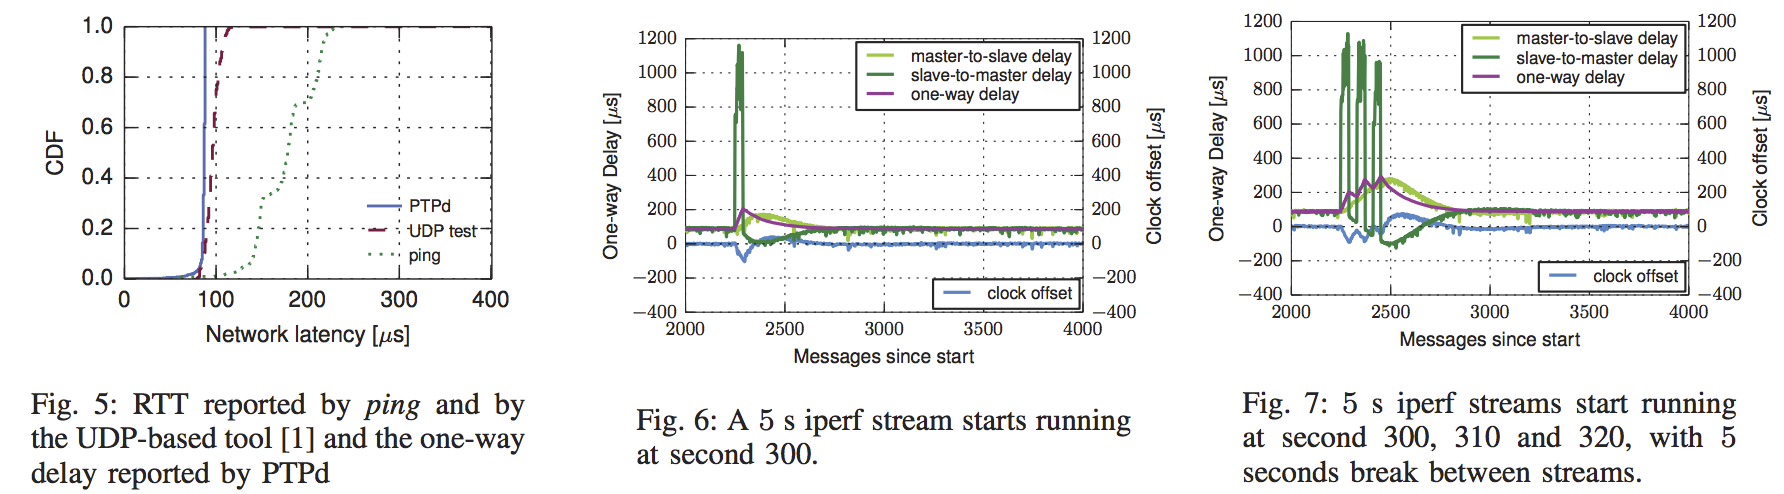
Once the two clocks synchronize (an initial starting period of 15 minutes is excluded from the plotted data for PTPd), the one-way delay reported is stable.
-
If there are several congestion episodes before the slave clock manages to resynchronize to the master clock, the one-way delay reported by the slave will not be indicative of the actual delay, although it will indicate that there is an event (congestion, failure) on that network path.
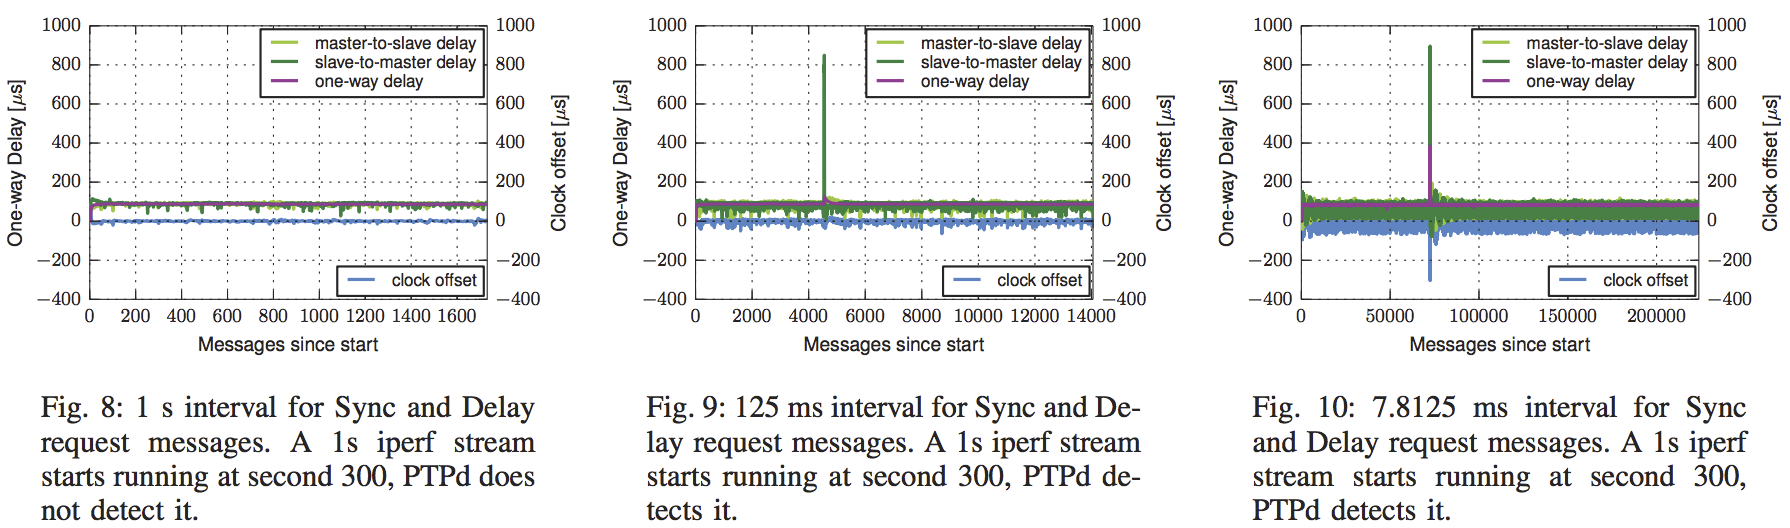
- The clock offset, master-to-slave and slave-to master delays oscillate between larger values when the Sync and Delay Request interval is larger.
-
-
Packet loss
PTPd records the number of messages sent and received (Announce, Sync, Followup, Delay Request, Delay Response), and it is possible to export them periodically. On the slave side, a difference between the number of Delay Request and Delay Response messages would indicate packet loss:
\[1- \frac{\#Delay\_Response\_messages}{\#Delay\_Request\_messages}\]
两个测量都只是coarse的estimate
Deployment
-
Cloud Provider: Hypervisor
-
Tenants: Inside VM
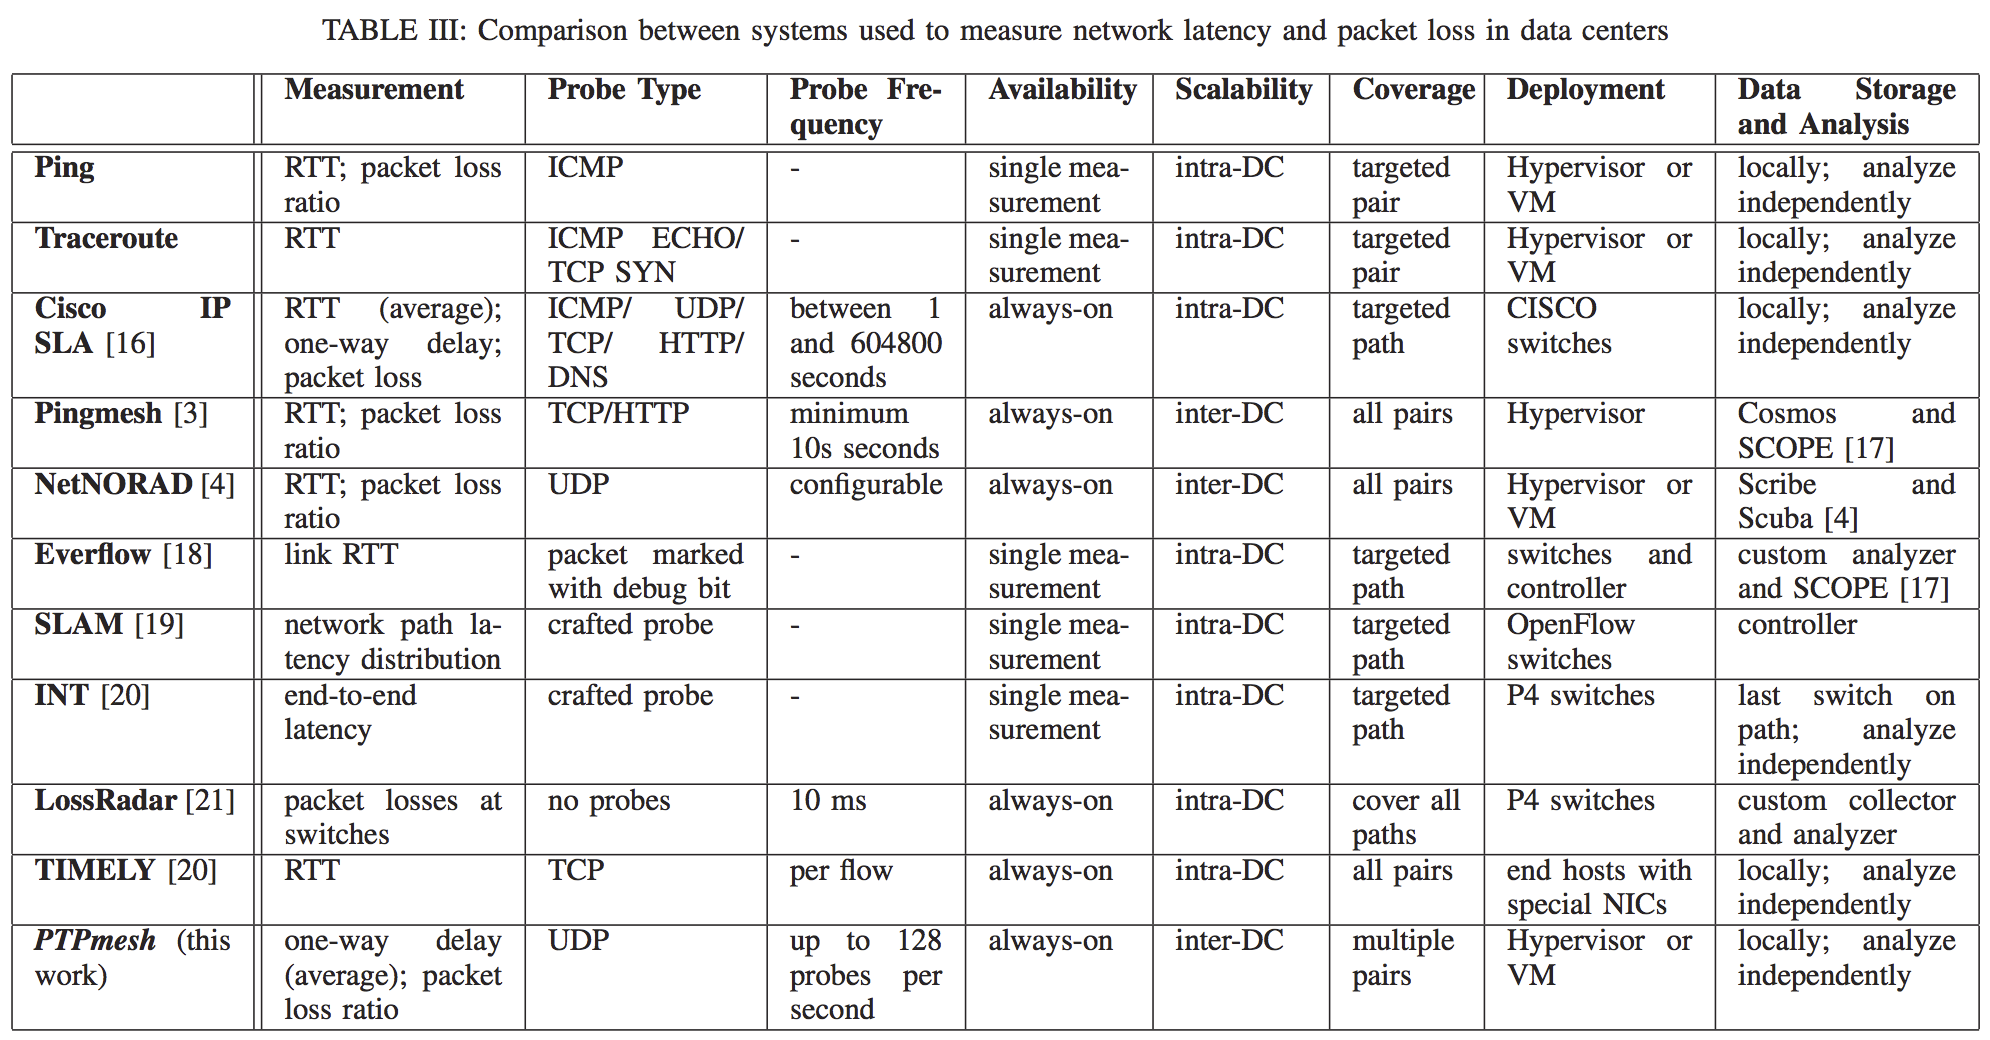
总结对比