核心思想
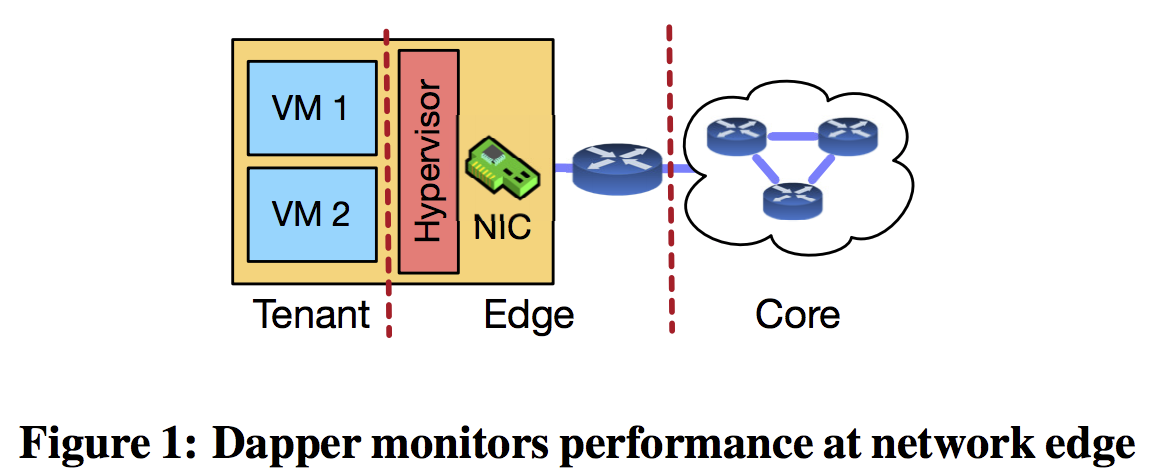
针对多租户场景在 network edge (e.g., hypervisor, NIC, or ToR switch) monitor TCP性能,诊断出一个connection是server-limited,network-limited还是receiver-limited.
主要挑战
需要在硬件(SmartNIC)上减少per-flow state存储开销
Design:infer and diagnose
(1)infer sender的信息:segment size(TCP option), 应用的reaction time, send rate;
We measure the reaction time using timestamps of incoming acknowledgments and outgoing packets. We compare the reaction time with an empirically derived threshold, calculated based on the latency between the edge and the VM. The reaction time consists of the application’s own data-generation latency plus the communication latency between the application and edge (i.e., latency in the hypervisor and virtual switch). Upon transmission of new packets, we update the packet and byte counters for each connection and measure the connection’s flight size to infer its sending rate (i.e., flight size/RTT ).
(2)Infer network的信息:loss(通过重传包,dupack个数,快重传), latency(通过RTT), congestion window(通过flight size和loss模拟窗口变化)
To determine and quantify the network limitation in the performance of a TCP connection, we need to measure and compare its congestion window—how much the network allows the connection to send—against the receive window—how much the receiver allows the connection to send—and how much data the sender has available to send. Latency的测量需要每传输一个新数据包在队列中维护一个元组(sequence,timestamp),ack到达后查询。Queue的长度与flight size成正比. Flight size可以认为是congestion window的lower bound. 丢包时multiplicative decrease, timeout后回到初始窗口
(3)infer receiver的信息:rwnd(每个包的rwnd, handshake时的window scaling factor), delayed ack
When an incoming ACK acknowledges multiple tuples in the queue, it must be a delayed ACK, as the client is acknowledging multiple segments at once.
(4)diagnose:receiver-limited, sender-limited, network-limited
- Sender: Exponential sending rate indicates a backlogged (sender-side is not limiting the connection’s performance) sender.
- Sender: If the sender is backlogged, it will “completely” use the send window.
- Sender: Sending less than allowed, or later than allowed, indicates a non-backlogged (limiting the sending rate via not having enough data to send or taking too long to produce it).More concretely, we check to see if a connection is sending packets that are smaller than MSS, or if the application’s reaction time (i.e., data generation time) is larger than an empirically derived threshold for backlogged applications.
- Sender: How the flight size changes during a loss recovery gives us a clue of how backlogged the sender is.
- Network: Small congestion window hurts TCP’s performance. flight size ≤ inf_cwnd < RWND.
- Network: Increased network path latency slows TCP’s rate.
- Receiver: Small receive window hurts performance. flight size ≤ RWND < inf_cwnd.
- Receiver: Delayed acknowledgment hurts performance. We measure the average number of RTT samples freed by each new ACK and if the average is greater than one, we diagnose the connection as receiverlimited due to delayed acknowledgment.
(5)减少硬件上资源消耗:两阶段monitor.
-
第一阶段为所有connection monitor light-weight的metric,只要能够发现connection有异常即可。选的metric是average flow rate (控制器定期query,发现有问题的流).
-
第二阶段为第一阶段的流开启diagnosis,收集heavy-weight metric,定位是sender-limited,network-limited还是receiver-limited的.
这样带来的问题是如果第一阶段没有提前获取MSS window scaling factor等信息,第二阶段的诊断会信息不足。
论文提出两个解决方法:一个是为所有connection在握手阶段收集这些信息 但是会消耗更多资源(否决)。另一个是在midstream 去infer MSS等信息。
-
infer MSS:需要track目前为止看到的最大的segment size.
-
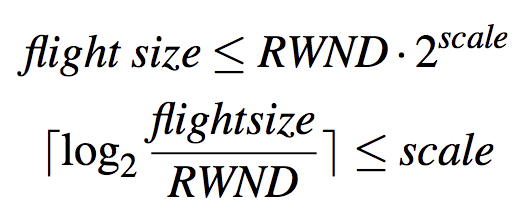
infer window scaling factor:通过flight size 和 rwnd (rwnd是unscaled的)估计出window scaling factor的lower bound
Implementation and evaluation
-
详细描述了P4以及如何利用P4实现,局限,解决方法
-
Accuracy的评价:software prototype(C libpcap库)实现,比较infer的metric和真实VM中linux的记录。
-
CPU and Memory Overhead
-
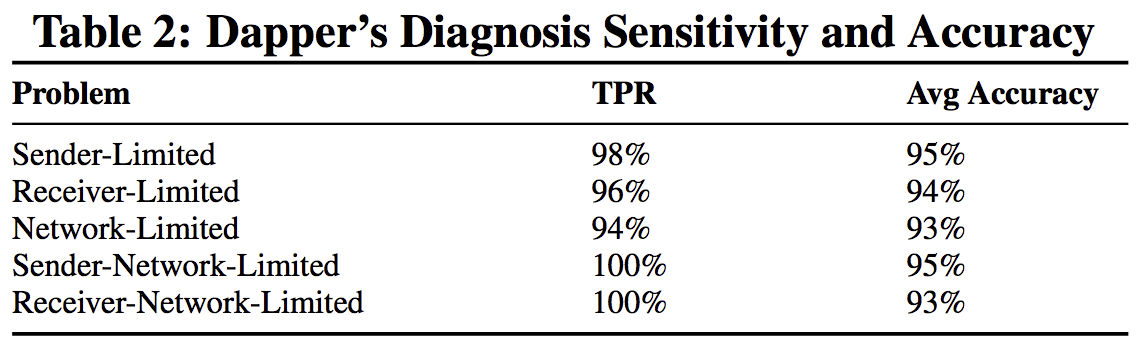
模拟了TCP connection的各类问题 测试Dapper诊断的准确性:
-
Analyzing CAIDA Traces 发现真实connection中的问题
-
Hardware的offload仍然实践中有问题。比如需要在多个stage access同一个register, 目前P4还不支持
My Thinking
- TSO GRO等技术对在hypervisor层的monitor的影响?比如在hypervisor monitor,现在网卡都默认开启TSO GRO,在hypervisor层看到的是大包,其实无法判断segment size。 在NIC上monitor 可以看到(可编程网卡如果不支持TSO)
- software:计算灵活 存储资源多 cpu utilization高; hardware:计算不灵活 存储资源受限 cpu utilization低